Data Source: The raw data comes from the Kansas Higher Education Statistics (KHESTATS) Portal of the Kansas Board of Regents
Peer Basket: A pool of five other public community colleges in Kansas whose ‘composite picture’ approximates many facets of Butler, and whose aggregate data is used for comparison purposes. Across these several indicators that are compared, Butler seeks to be competitive with its peers.
Timeframes: The different data points are updated by the Kanas Board of Regents (KBOR) at different times; please pay close attention to the descriptions in each of the charts. We aim to keep this page updated on a regular basis as fresh data becomes available from KBOR.
Indicator descriptions: There are ten indicators being compared as follows:
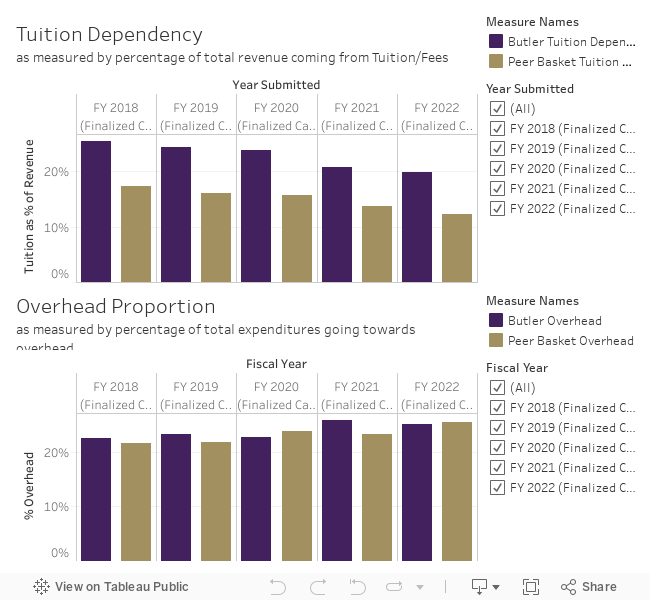
Tuition Dependency: Percentage of total revenue that comes from tuition & fees
Overhead Proportion: Percentage of total expenditures going towards physical plant and institutional support in audited financial statements
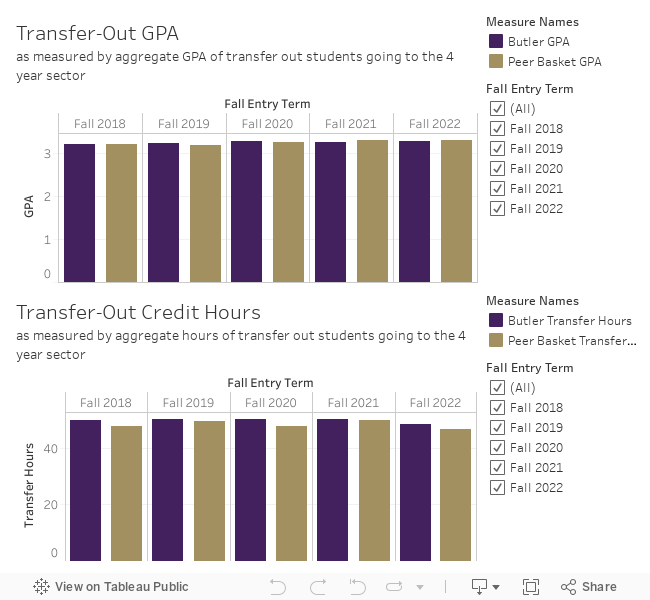
Transfer-Out GPA: Average transfer GPA of Butler students transferring into Kansas public universities each fall
Transfer-Out Hours: Average credit hours transferred by Butler students transferring into Kansas public universities each fall
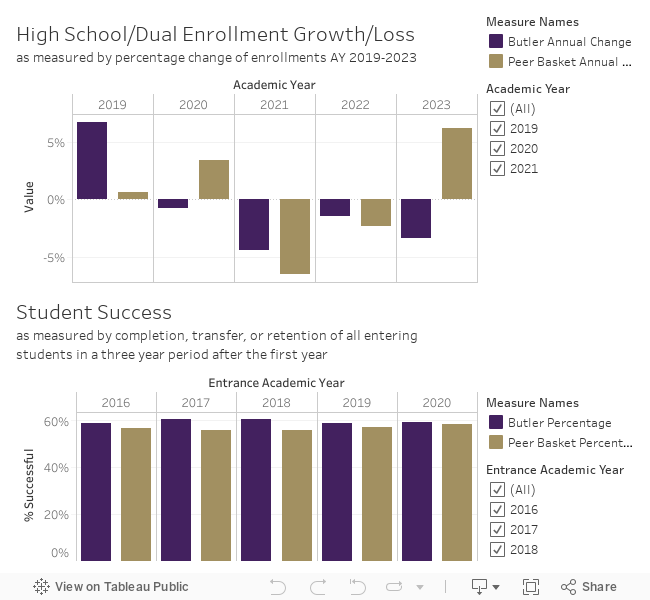
High School EnrollmentChange: Year over year FTE percentage change in enrollment of High School students at Butler
Student Success: Completion, transfer, or retention over a three-year period after the first year in college
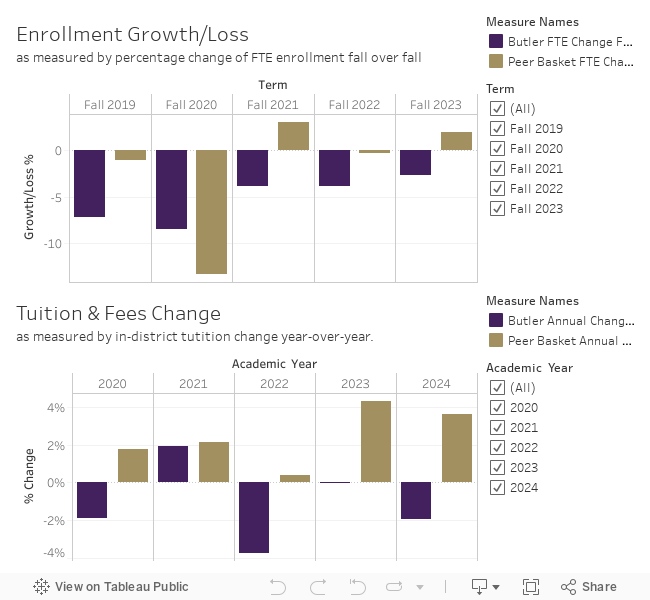
Enrollment Growth/Loss: Fall term over fall term FTE enrollment change percentage
Tuition Change: Percentage of year over year change for semester tuition & fees for in-district students
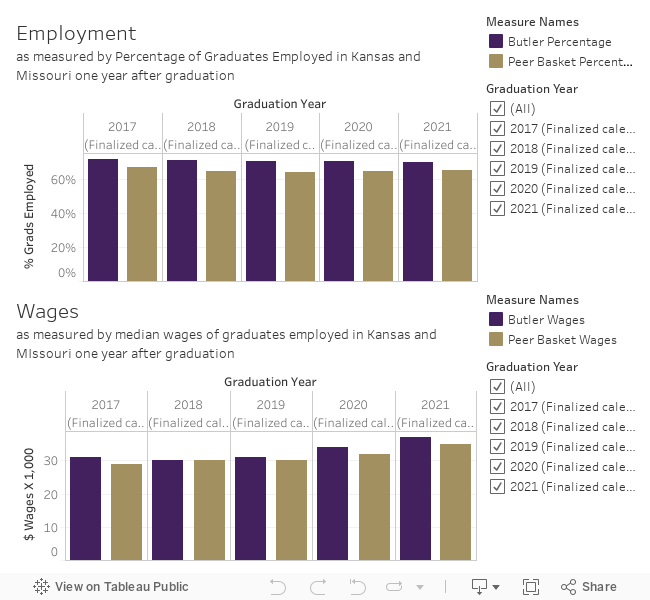
Employment: Regional job placement (in KS and MO) after one year of leaving college
Wages: Annual average starting wage after one year of leaving college
Data Source: Kansas Higher Education Statistics (KHESTATS) Portal of the Kansas Board of Regents
Peer Basket: A pool of five other public community colleges in Kansas whose ‘composite’ approximates many facets of Butler and whose aggregate data is used for comparison purposes
Timeframes: The different data points are updated by the Kanas Board of Regents at different times; please pay close attention to the descriptions in each of the charts*
Benchmarks for Butler
Tuition Dependency: Within +3 % of Peer Basket or at par
Overhead Proportion: Within +3 % of Peer Basket or at par
Transfer-Out GPA: Higher GPA than Peer Basket or par
Transfer-Out Hours: Higher Greater number of credit hours transferred than Peer Basket or at par.
High School Enrollment Change: Greater than Peer Basket over a five year period (this is new in 2021)
Student Success: Higher Percentage than Peer Basket or at par
Enrollment Growth/Loss: Higher enrollment growth or lower enrollment loss than Peer Basket or at par
Tuition Change: Within +3 % of Peer Basket or at par
Employment: Higher Percentage Employed than Peer Basket or at par